Showing posts with label SCOM. Show all posts
How to Audit and Alert Server Restarts with SCOM 2019 (2012/16)
2016
,
Audit
,
Restart
,
SCOM
,
SCOM 2016
,
SCOM 2019
,
System Center 2012 R2
,
System Center 2016
,
System Center 2019
,
Virtual Machines
,
Windows Server
,
Windows Server 2016
,
WIndows Server 2019
,
Winows 10
No comments
How to Audit and Alert Server Restarts with SCOM 2019 (2012/16)
Often IT admins
suffer from small to big outages due to unscheduled patches, failures, power, or someone mistakenly restarting a server in the middle of the workday without notifying anyone. I've created
this "How to Guide" to help you set up this in your SCOM environment.
- On your SCOM Console,
navigate to authoring and create a new Rule
- Fill in the Rule Name and
Description, select Rule Category (Alert), rule Target (Windows Computer)
and make sure Rule is enabled is checked.
- Event Log Type System
- Build Event Expression insert
Event ID and Source
- Insert values where Event ID
= 1074 and Event Source = User32.
- Set Alert Priority and Severity to fit your needs then Finish and Close
- Overview of your recently
configured rule on the Squared Up HTML5 Console
That's it, you will
now start tracking those restarts.
Thanks for reading, please share and
subscribe.
How to Audit and Alert Server Restarts with SCOM 2019 (2012/16)
Often IT admins
suffer from small to big outages due to unscheduled patches, failures, power, or someone mistakenly restarting a server in the middle of the workday without notifying anyone. I've created
this "How to Guide" to help you set up this in your SCOM environment.
- On your SCOM Console, navigate to authoring and create a new Rule
- Fill in the Rule Name and Description, select Rule Category (Alert), rule Target (Windows Computer) and make sure Rule is enabled is checked.
- Event Log Type System
- Build Event Expression insert Event ID and Source
- Insert values where Event ID = 1074 and Event Source = User32.
- Set Alert Priority and Severity to fit your needs then Finish and Close
- Overview of your recently configured rule on the Squared Up HTML5 Console
That's it, you will
now start tracking those restarts.
Thanks for reading, please share and
subscribe.
SCOM 2019 UR1 - Simplified Patching Finally Arrived!
SCOM 2019 UR1 - Simplified Patching Finally Arrived!
Simplified management server patching
UR1 introduces a frictionless way of patching the SCOM servers. This new funtionaity will enable you to update your MGMT servers, update configs for Operational and DW DBs and MPs easly with just one step versus in the past that you pretty much needed to update each component separately.
To see more details on What's New click here.
Improvements and fixes
Web Console fixes and changes
- The State widget now supports sorting by health and age.
- Alert widgets can now be searched on by Date Time and sorted based upon age and severity.
- The alert link in an email notification returned the following error message when it's browsed: “Your session with the Web Console server expired." This occured even though the user was not logged in to web console. You will now see the login page post this fix.
- The Alert summary view window in SCOM Web console can now be expanded as required.
- When the Alert state was changed to some custom state, these alerts were not displayed in the web console. Alerts that have custom resolution states are now displayed.
- Some additional scrollbars appear if a customer widget is created in the web console or if the browser window size is reduced.
- Improvement: SCOM views load and save much faster than previously.
For more fixes and improvements click here.
Repost: Microsoft Docs and Support.
One-Click Patching coming for SCOM 2019 Update Rollup 1 (UR1)
2016
,
Cloud and Datacenter Management
,
SCOM
,
SCOM 2019
,
System Center 2019
,
Update Rollup
,
Windows Server
,
Windows Server 2016
,
WIndows Server 2019
No comments
One-Click Patching coming for SCOM 2019 Update Rollup 1 (UR1)
I'm so glad this is finally happening as it is quite a challenge to perform the upgrades on all servers + the DB scripts. There are also lots of great improvements for the Storage Spaces Direct monitoring, Azure MP, gMSA support.
Based on the MS Ignite presentation the first UR should be coming up on Q1. WIll be posting more updates once the official announcement is published.
References:
How to connect Operations Manager 2019 (SCOM) to Azure Log Analytics (AKA OMS) in 4 simple steps
Azure
,
Azure Log Analytics
,
Cloud
,
Cloud and Datacenter Management
,
OMS
,
SCOM
,
SCOM 2019
,
System Center 2019
No comments
How to connect Operations Manager 2019 (SCOM) to Azure Log Analytics (AKA OMS) in 4 simple steps
Architecture Overview
Requirements:
1. Have your SCOM environment to be allowed to connect to 443 port over the internet.
2. An Active Azure subscription (This could be a trial one)
3. Admin Credentials to your Azure environment.
More details at Microsoft Docs
Step by Step
1. Register or Connect to Azure Log Analytics2. Sign in to your Microsoft Azure Account
3. Select Azure Log Analytics Workspace
4. Review and Create and after a couple of minutes, your workspace will be configured.
Heres my workspace
Thank you for viewing, please follow my LinkedIn and Twitter for more solutions and fixes.
References: Microsoft Docs
Thank you for viewing, please follow my LinkedIn and Twitter for more solutions and fixes.
References: Microsoft Docs
How to configure SCOM HTML Notification Alerts from Orchestrator 2012/16 Step by Step
How to configure SCOM HTML Notification Alerts from Orchestrator 2012/16 Step by Step

This post is another great option that could be quite effective when you are notifying your engineers/application owners. This type of email formatting will allow them to easily read and take appropriate actions to correct the reported issues instead of trying to translate a very complicated and non organized text.

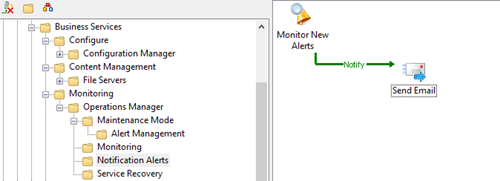

On the SCOM Alert Monitoring Activity, add Title, SCOM connection, the trigger for New alerts and your needed filters.
Note: If you are looking for a closed alert email then you will need to select the Updated alerts trigger and status closed.

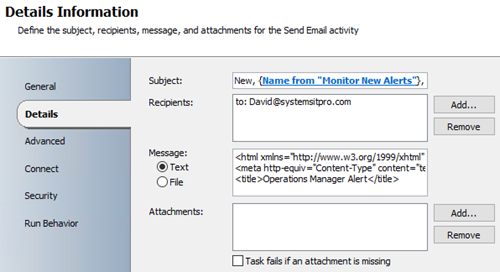
On the Send Email Activity, set the Title and Message Format to HTML.

On the Details Page Subject section, set your Subject details and subscribe to your monitoring data so you can dynamically display the alert name/instance.

On the Details Page Recipients section, set the email accounts that will be receiving this notification.

On the Details Page Message section, copy and paste the HTML formatted code you’re your published data IDs.
While working with your message you can also expand to have a better view of the HTML code.

Review your code and test with Notepad++ or Visual Studio then proceed to configure your SMTP/email channel.
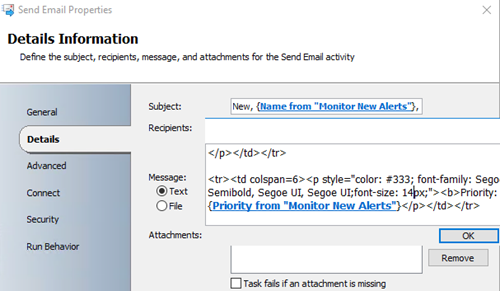
On the published data you can add the needed fields to the message section select them all, copy and paste them into a notepad to get the actual ID which its way easier to add into your HTML code.


On the Connect page, set your Email address and SMTP connection.

Close all the activities and Check in the Runbook.

Here’s the email design that you will be sending out, feel free to customize and comment with your updates
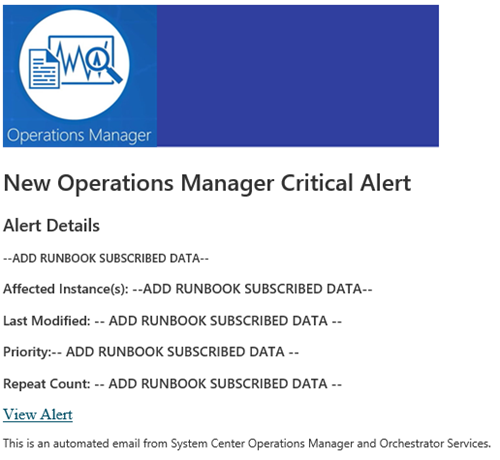
Hope this post was helpful and makes your IT life a bit easier

This post is another great option that could be quite effective when you are notifying your engineers/application owners. This type of email formatting will allow them to easily read and take appropriate actions to correct the reported issues instead of trying to translate a very complicated and non organized text.
Before you start
- Make sure you have the SCOM Orchestrator integration pack installed and configured.
- Make sure your credentials and Orchestrator have access to your SCOM environment.


Creating the Runbook
On Orchestrator Runbook Designer Console, create a new Runbook and add the following activities;- Monitoring Alerts
- Email Activity

On the SCOM Alert Monitoring Activity, add Title, SCOM connection, the trigger for New alerts and your needed filters.
Note: If you are looking for a closed alert email then you will need to select the Updated alerts trigger and status closed.

On the Send Email Activity, set the Title and Message Format to HTML.

On the Details Page Subject section, set your Subject details and subscribe to your monitoring data so you can dynamically display the alert name/instance.

On the Details Page Recipients section, set the email accounts that will be receiving this notification.

On the Details Page Message section, copy and paste the HTML formatted code you’re your published data IDs.

While working with your message you can also expand to have a better view of the HTML code.

Review your code and test with Notepad++ or Visual Studio then proceed to configure your SMTP/email channel.

On the published data you can add the needed fields to the message section select them all, copy and paste them into a notepad to get the actual ID which its way easier to add into your HTML code.


On the Connect page, set your Email address and SMTP connection.

Close all the activities and Check in the Runbook.

Click here to Download the actual HTML code and image.
Here’s the email design that you will be sending out, feel free to customize and comment with your updates

Hope this post was helpful and makes your IT life a bit easier
Installing the new SCOM 2016 SQL Server Dashboards and utilizing the new SCOM HTML based Web Console.
Installing the new SCOM 2016 SQL Server Dashboards and utilizing the new SCOM HTML based Web Console
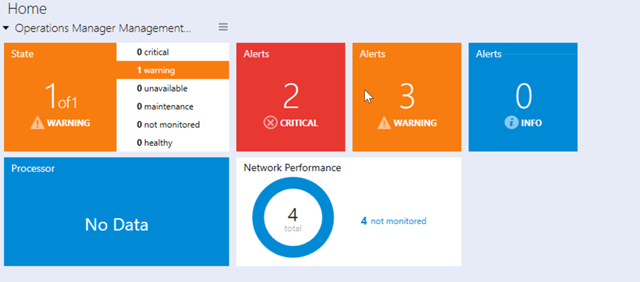
If you are a SCOM administration this is another feature that you will really appreciate from the MS side. As you might know Dashboards and Business views are critical so upper management or you call center can have a graphical view of what's healthy or not in your environment. Now you and you're staff is not forced/required to use IE so they are now able to use Edge, Mozilla, Chrome or any other preferred browser.
Step by Step
- Import the SQL Server Dashboards Management Packs on your SCOM Management Server.

- After importing Open your Operations Manager Console.
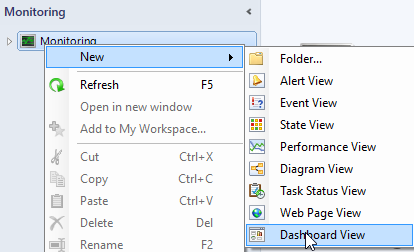
- Go to Monitoring Workspace then right click Monitoring and select New then Dashboard View.
- Select SQL Server Dashboards, Datacenter Dashboard then Next.

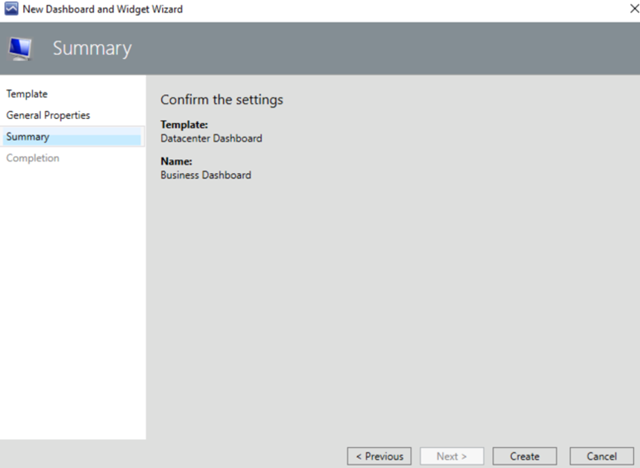
- Enter the Dashboard Name and Description, confirm, Next and Create.
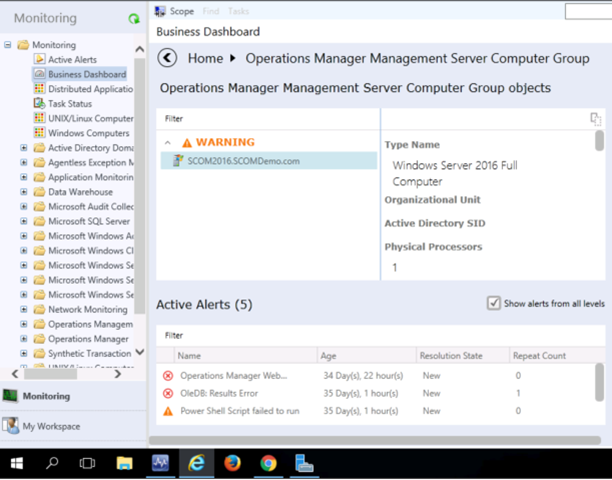
- After creating now you should be able to add your widgets, tiles and performance views.

- That's it now you can start adding any of monitored systems to this view.


- Accessing the dashboard view via Google Chrome and IE using the HTML based SCOM Console.

Subscribe to:
Posts
(
Atom
)


